 |
Michael T. Bland Research Space Scientist,
|
Current and Recent Projects
Mountains on Io
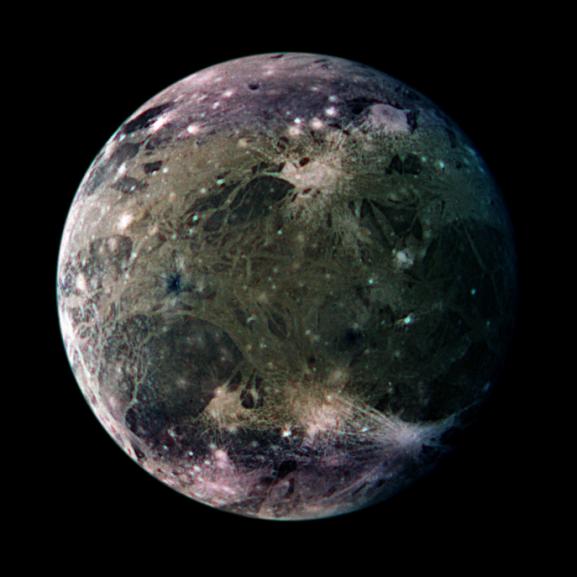
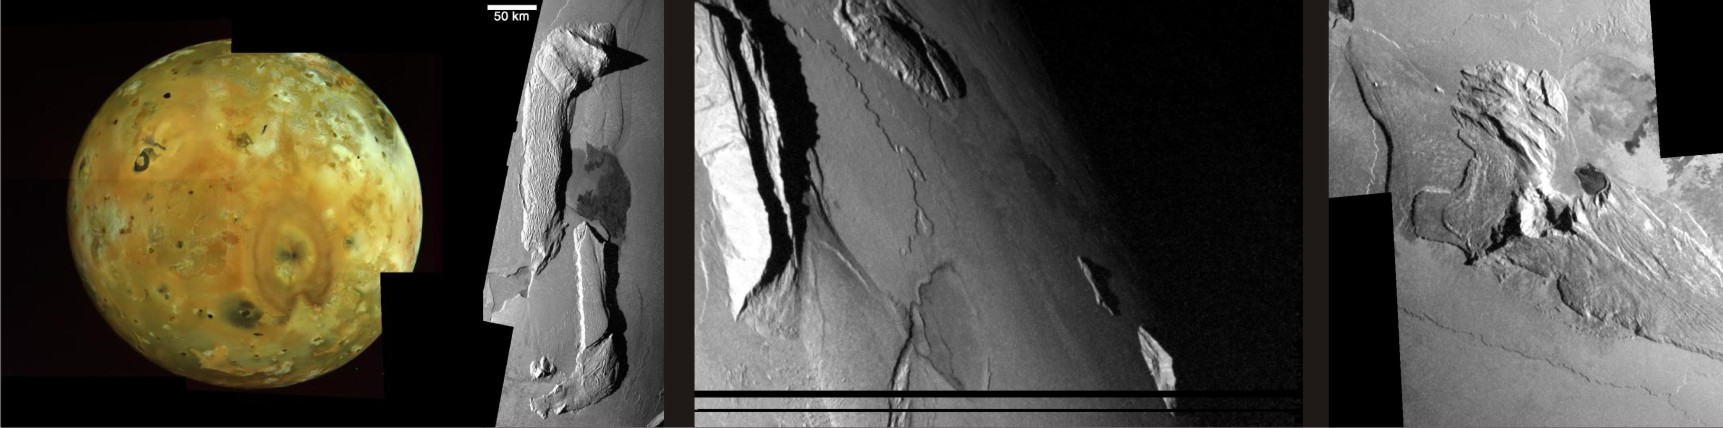 Io's mountains from NASA's Galileo mission. From left to right: global mosaic of Io; Hi'iaki Mons; Mongibello Mons; Tohil Mons. All images NASA/JPL-Caltech.
Io, Jupiter's inner most satellite, is covered with isolated mountains that rise as much as 10 kilometers (or more) above the moon's surface. Despite Io's prolific volcanism, the mountains do not appear to be volcanic constructs, instead appearing as tilted and tectonically uplifted crustal blocks. Despite their apparent tectonic origin, the mountains may ultimately result from Io's intense volcanic activity. Eruption rates on the moon are high enough (~1 cm/yr globally) that global resurfacing occurs rapidly. As new lava is emplaced on the surface, the older surface layer is forced downward into the interior. As the surface layers subside, thier surface area must decrease, forcing the lithosphere into a state of compression [see Schenk and Bulmer 1998]. Such compression, which maximizes above Io's asthenosphere, could lead to the formation of deep-seated thrust faults, along which isolated lithospheric blocks are uplifted.
As a first-order test of this hypothesis for mountain building, we are using computer models (lagrangian finite element) to simulate compression of Io's lithosphere with a constant horizontal velocity boundary condition that increases linearly with depth. The geometry is simplified from the actual situation on Io, but we directly mimic the style of compression due to the global inward advection of volcanic layers. The model is viscoelastic-plastic and includes strain weakening and non-associative plasticity [see Bland and McKinnon submitted]. We assume the dry diabase rheology and a vertical temperature profile from the analytical calculations of Kirchoff and McKinnon [2009].
Results from a typical simulation are shown below. Compression results in initial brittle failure (magnitude shown on color scale) deep in the lithosphere. As strain increases, the fault-like deformation propagates upward until eventually breaching the surface and causing uplift of the over-thrusted block. Surface uplifted is limited by the model constraints. Once an orogenic fault forms, further regional subsidence or thermal expansion strain should be accommodated by continued fault motion, giving rise to the spectacular mountains we see today.Significantly, the development of the thrust fault results in a decrease in the compressive stress in the upper portion of the lithosphere. Thus, despite the global compressive stress regime, deeply formed thrust faults on Io naturally give rise to regions of surface tensile stress and extensional strain. Such regions may provide pathways for magma to reach Io's surface.
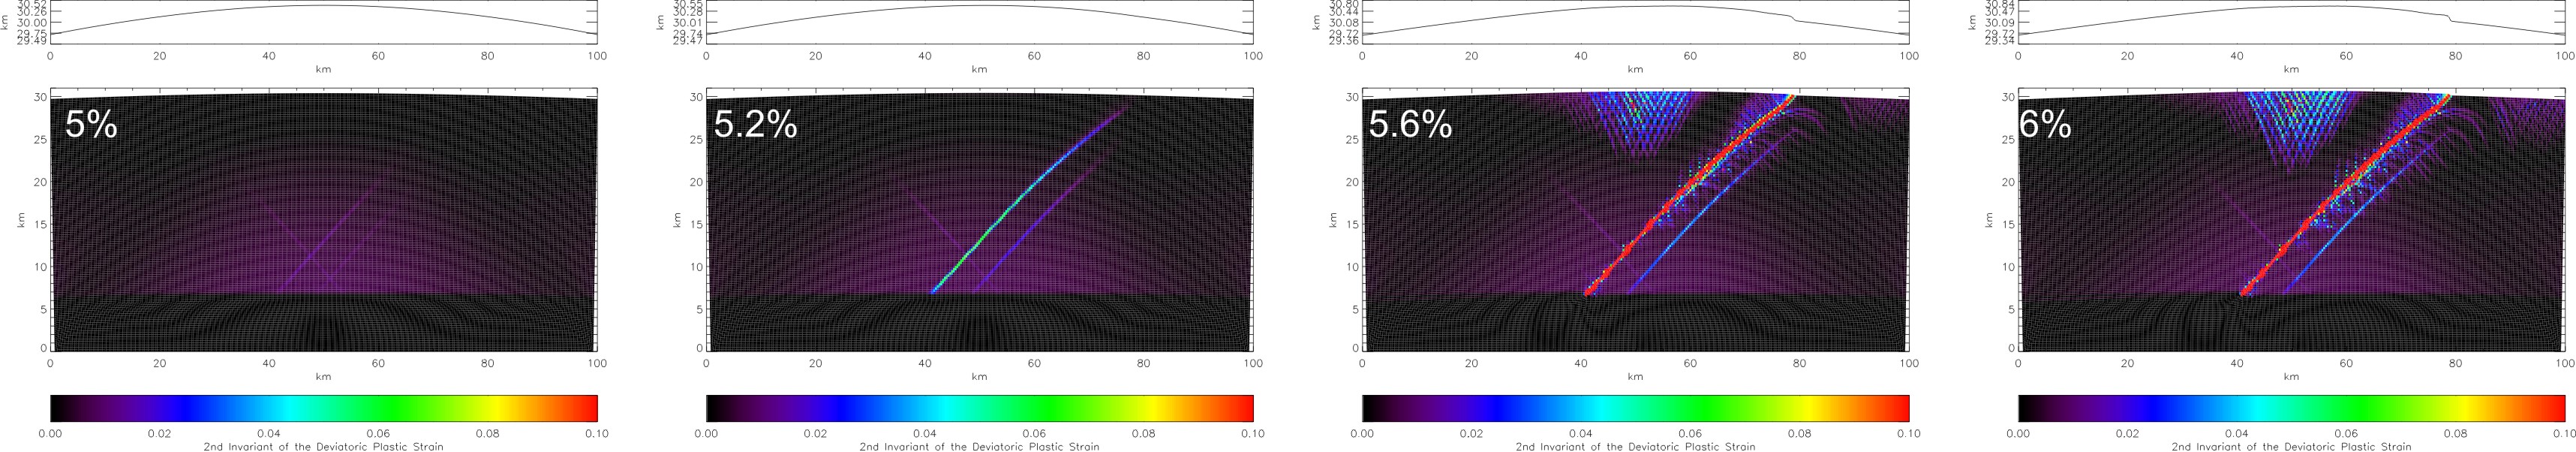 Development of a deep-seated thrust fault on Io. Each panel shows the same simulation at increasing values of strain. The deep lithosphere is strained more than the near-surface, consistent with subsidence. The thrust fault initiates deep in the lithosphere and propagates toward the surface. In the final two panels, thrusting leads to zones of extensional fracturing in the upper lithosphere.
For more on our groups work on Io's Mountains check out these recent abstracts:
- Bland, M. T., McKinnon, W. B. (2014). Deep faulting, stress release, and mountain formation on Io. Lunar Planet. Sci. Conf. #2502.
Enceladus' recent and ancient heat flux
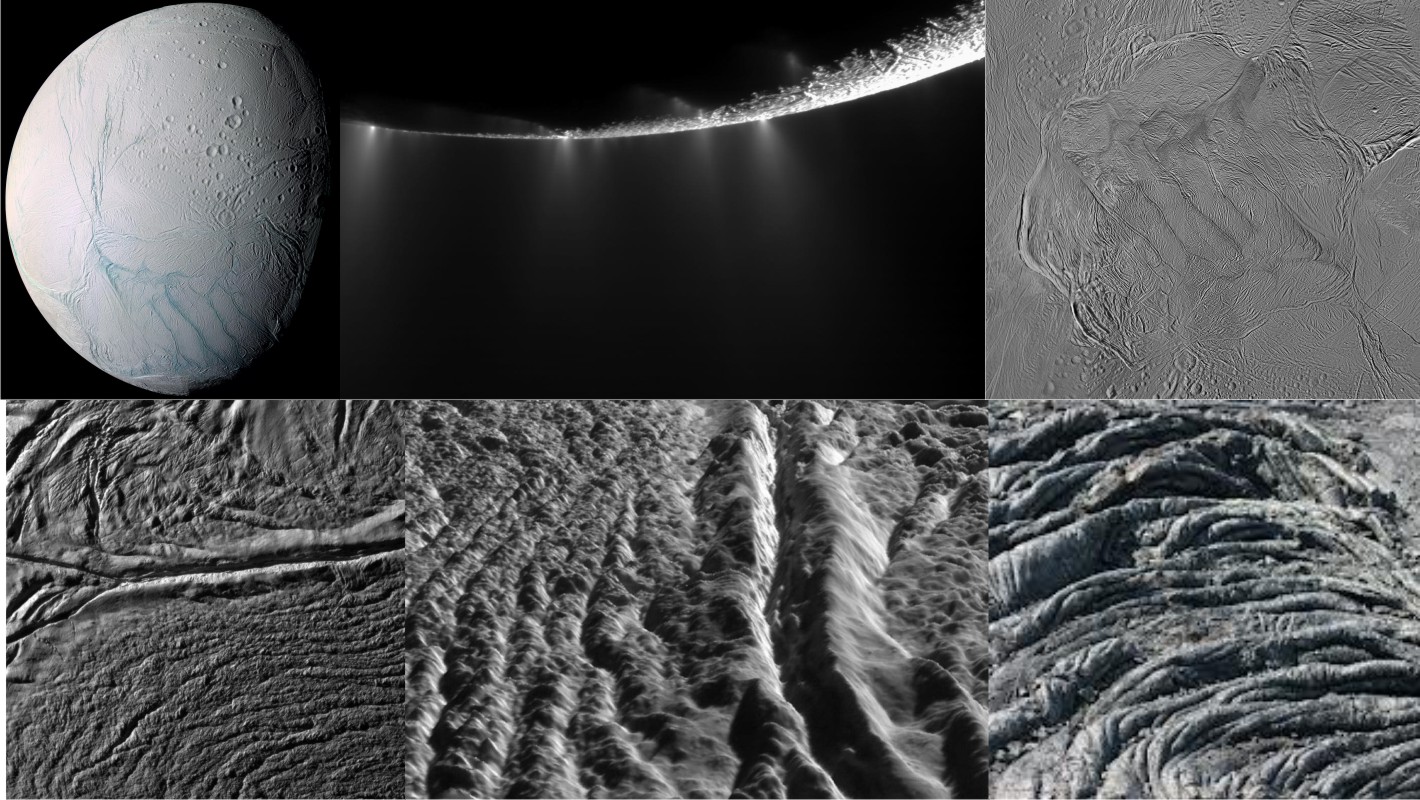 Top left: Global view of Enceladus. Top center: Plumes emanating from Enceladus' south-polar fractures. Top right: Mosaic of Enceladus' south-polar terrain. Bottom left: High-resolution image of a "tiger stripe" (Damascus Sulcus - central fracture in image) and ropy "funiscular terrain" (below Damascus). Bottom center: Perspective view of Damascus Sulcus and funiscular terrin (courtesy of Paul Schenk). Bottom right: Ropy pahoehoe lava (courtesy wikipedia). Images NASA/JPL-Caltech.
Saturn's icy moon Enceladus is one of the coolest objects in our Solar System. Despite it's small size (it's surface area is comparable to that of Turkey's) it's geologically active, with plumes of ice and vapor venting from large fractures near it's south pole. The heat flow in the region near the vents (i.e., the geologically young south-polar terrain or SPT) was measured by the the Cassini CIRS instrument to be ~5 GW or more - shockingly high. High resolution measurements by the VIMS and CIRS instruments indicate that the high heat flow is localized on the SPT fractures themselves (often colloquially called “tiger stripes”). In contrast, the heat flow between the fractures is more poorly constrained, though a discrepancy between wide-field and high-resolution CIRS measurements suggests it may be high. Understanding the geologically recent thermal history of the SPT generally, not just the currently active vents is central to understanding the formation of the SPT itself and the broader geologic history of the moon.
Enceladus' SPT is a quasi-circular depression located within 35 degrees of the pole. The 1-Ma-old surface contains extensive tectonic deformation, including the four linear, evenly spaced (~35 km) fractures (the Tiger stripes). Between the Tiger Stripes is terrain characterized by moderate-amplitude (50-100 m), tightly-hinged, ridges and troughs with a characteristic spacing of 1 km. The terrain has a ropy appearance and so has been given the name “funiscular terrain” terrain (see above). The ridges generally trend roughly parallel to the Tiger Stripes, though in places intersect them at small angles. Along-strike ridge morphology can be complex. Notably, the funiscular morphology is unique to the regions directly between the Tiger Stripes themselves.
The unique morphology of the funiscular terrain may provide clues to the tectonic and thermal history of the central portion of the SPT. Such clues can only be revealed by understanding how the observed deformation of the surface came to be. Barr and Pruess [2010], noting the morphological similarities between the funiscular terrain and ropy pahoehoe lava (above) suggested that the terrain formed as tightly-hinged folds in a very thin (250-500 m), brittle surface layer.
We are currently rigorously testing this hypothesis using computer simulations of the lithospheric shortening of an ice lithosphere under Enceladus-like conditions. We have investigated both simplified, two-layer geometries (below, left) and more realistic conditions (below, center). In either case the goal is to investigate the behavior of a very thin lithosphere under compression. Our simple two-layer models can reproduce the surface morphologies observed in the funiscular terrain. However, when more realistic (though still extreme) conditions are used producing short-wavelength folds becomes difficult. Even for heat fluxes as high as 400 mW m-2 the lithosphere is too thick to produce folds wavelengths of ~1 km. If the funisucular terrain resulted from thin-skinned folding, as suggested by Barr and Pruess [2010], it implies that the heat flux between Enceladus' Tiger stripes was extremely high when the folds formed.
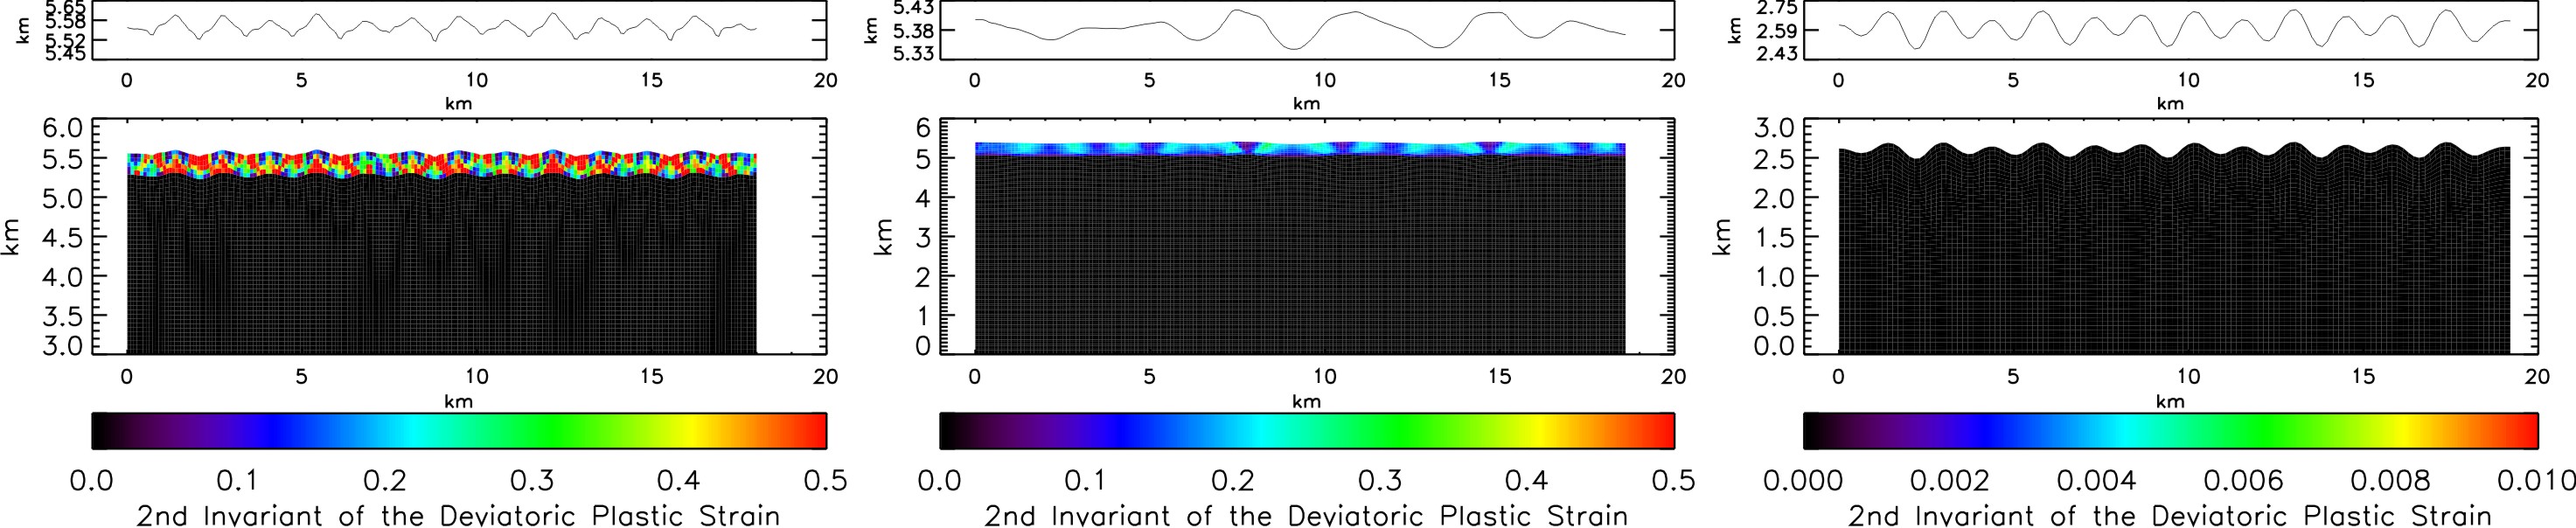 Simulations of lithospheric shortening on Enceladus. Left Deformation of a thin (250 m) stiff layer (uniform high viscosity) overlying ductile ice (uniform low viscosity) after 10% shortening. Colors indicate where brittle failure has occurred. The simple (though unrealistic geometry) reproduces funiscular terrain morphologies. Center As at left but for a realistic, though extreme, thermal structure (F=400 mW m-2) for high porosity ice (low thermal conductivity) after 7% shortening. Even assuming a high heat flux, the wavelength of the deformation (which is controlled by the lithospheric thickness) is too long. Right As at left but for a purely viscous case (Newtonian rheology) and “exotic” thermal structure. The deformation produced is realistic but the physical model may not be…
For more information check out the following abstracts:
- Bland, M. T., McKinnon, W. B. (2014). Constraining the heat flux between Enceladus' Tiger Stripes: Numerical modeling of funiscular plains formation. Lunar Planet. Sci. Conf., #2079.
- Bland, M. T., McKinnon, W. B. (2013). Clues to the formation of Enceladus' south-polar terrain from simulations of funiscular plains formation. Fall AGU conf., P53B-1866.
The formation of Ganymede's grooved terrain
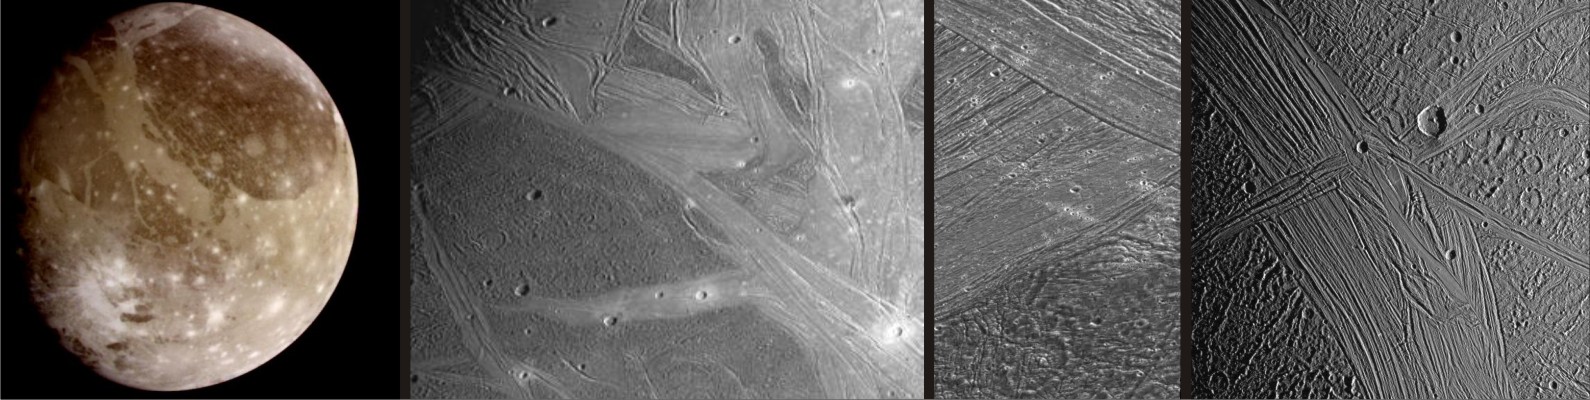 Ganymede's grooved terrain. From left to right: Global image of Ganymede; Interwoven light grooved terrain (Philus, Nippur, and Akitu Sulcus) and dark cratered terrain (Marius Regio); High-resolution image of intersection of two groove swaths (Nippur and Philus) and Marius regio; Groove terrain swath (Tiamat Sulcus) slicing through dark terrain. Images NASA/JPL-Caltech.
Ganymede is awesome! I'll describe what we're up to shortly. In the meantime you can check out our recently submitted paper.
- Bland, M. T. and McKinnon, W. B., 2014. Forming Ganymede's grooves at smaller strain: Toward a self-consistent local and global strain history for Ganymede. Icarus, submitted.
- Bland, M. T., McKinnon W. B., Showman A. P., 2010. The effects of strain localization on the formation of Ganymede's grooved terrain. Icarus 210, 396-410.
- Bland, M. T., Showman A. P., 2007. The formation of Ganymede's grooved terrain: Numerical modeling of extensional necking instabilities. Icarus 189, 439-456.
The internal structure of Titan
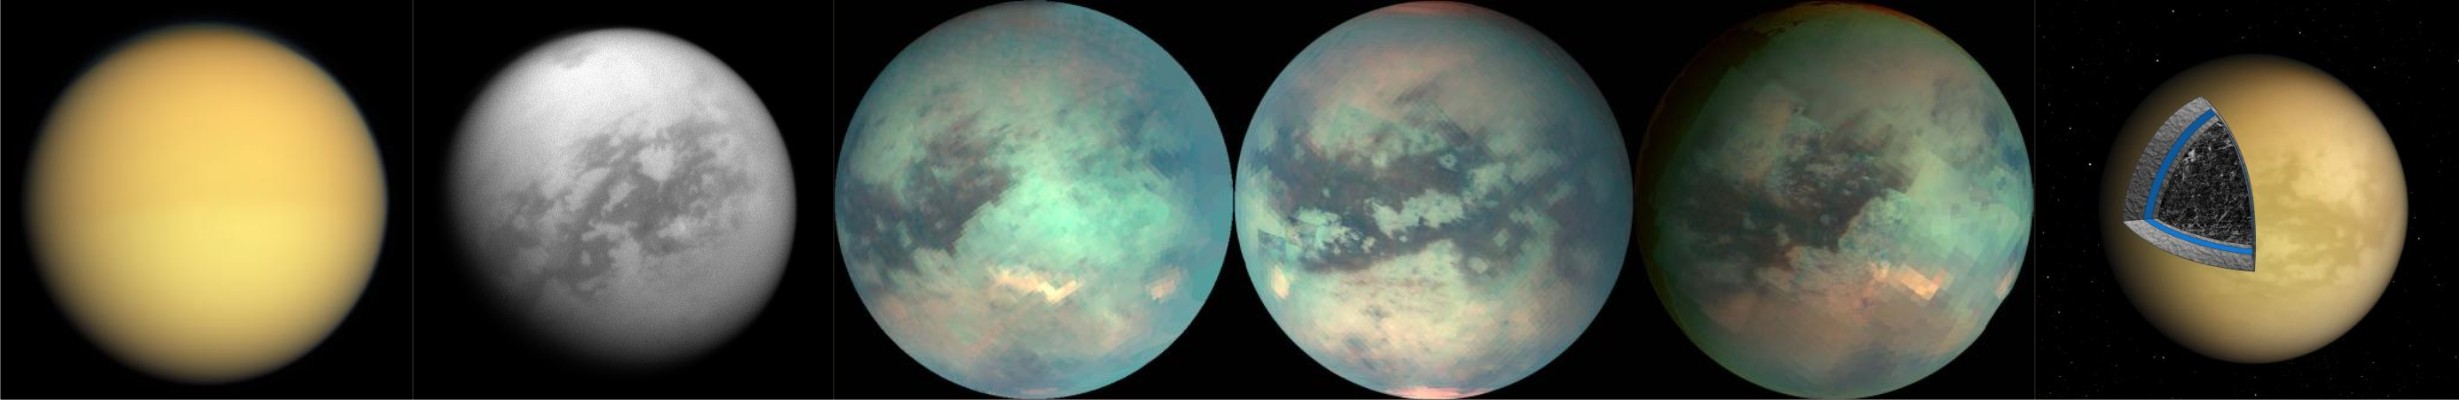 Saturn's moon Titan. From left to right: Visible light; Cassini ISS image at 980 nm; Cassini VIMS composite (1.6 microns - blue, 2.01 microns - green, 5 microns - red); Cartoon of Titan's interior structure. Images NASA/JPL-Caltech.
Saturn's moon Titan is pretty cool too. I'll describe what we're up to soon. In the meantime check out these abstracts.
- McKinnon, W. B., and Bland, M. T. (2013). Differentiation of large outer Solar System satellites: Implications for core chemistry, internal structure, and non-hydrostatic gravity. Lunar Planet. Sci. Conf. 44, 2983.
- Bland, M. T., McKinnon, W. B. (2012). Thermal and structural evolution of a partially differentiated Titan. AAS Div. Planet. Sci. Conf., 201.04.
- Bland, M. T., McKinnon, W. B. (2012). Thermal and compositional evolution of a three-layer Titan. Titan Through Time 2 Workshop, 1.1.2.
- McKinnon, W. B., Bland, M. T. (2011). Interior of Titan: 2-Layer or 3-Layer and Does It Matter? Fall AGU Conf., P33F-04.
For more information see our outer planets group page.

- Bland, M. T., McKinnon, W. B., 2014. Forming Ganymede's grooves at smaller strain: Toward a self-consistent local and global strain history for Ganymede. Icarus submitted.
- Bland, M. T., 2013. Predicted crater morphologies on Ceres: Probing internal structure and evolution. Icarus 226, 510-521.
- Bland, M. T., McKinnon, W. B., 2013. Does folding accommodate Europa's contractional strain? The effect of surface temperature on fold formation in ice lithosperes. Geophys. Res. Lett. 40, 2534-2538, doi:10.1002/grl.50506.
- Bland, M. T., McKinnon, W. B., 2012. Forming Europa's folds: Strain requirements for production of large-amplitude deformation. Icarus 221, 694-709.
- Bland, M. T., Singer, K. N., McKinnon, W. B., Schenk, P. M., 2012. Enceladus' extreme heat flux as revealed by its relaxed craters. Geo. Res. Lett. 39, L17204.
- Bland, M. T., McKinnon W. B., Showman A. P., 2010. The effects of strain localization on the formation of Ganymede's grooved terrain. Icarus 210, 396-410.
- Mitri, G., Bland, M. T., Showman, A. P., Radebaugh, J., Stiles, B., Lopes, R. M. C., Lunine, J. I., Pappalardo, R. T. 2010. Mountains on Titan: Modeling and observations. JGR-Planets 115, E10002.
- Bland, M. T., Showman, A. P., Tobie, G. 2009. The thermal-orbital evolution and global expansion of Ganymede. Icarus 200, 207-221.
- Bland, M. T. 2008. The tectonic, thermal, and magnetic evolution of icy satellites. Ph.D. Dissertation, University of Arizona.
- Bland, M. T., Showman, A. P., Tobie, G., 2008. The production of Ganymede's magnetic field. Icarus, 198, 384-399.
- Bland, M. T., Beyer, R. A., Showman, A. P., 2007. Unstable extension on Enceladus. Icarus 192, 92-105.
- Bland, M. T., Showman A. P., 2007. The formation of Ganymede's grooved terrain: Numerical modeling of extensional necking instabilities. Icarus 189, 439-456.
**The information provided here is only intended for personal use and scholarly sharing. All other use prohibited.

 928-556-7080
 |
 mbland at usgs dot gov
|
| Last revised: 14-Jan-2014 |
| Overview
| People
| Contact
| Academics | Courses
| | Research | What's New | Resources & Facilities | | Webmaster| |
back to home page |
|