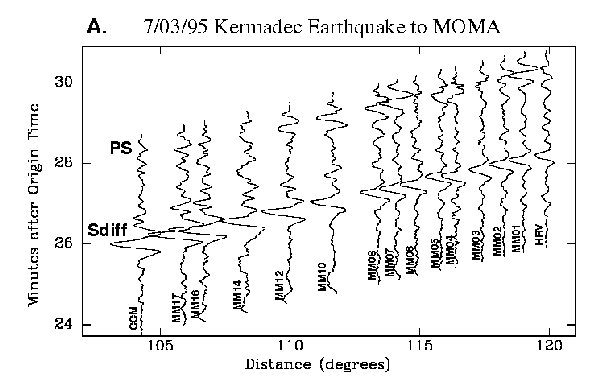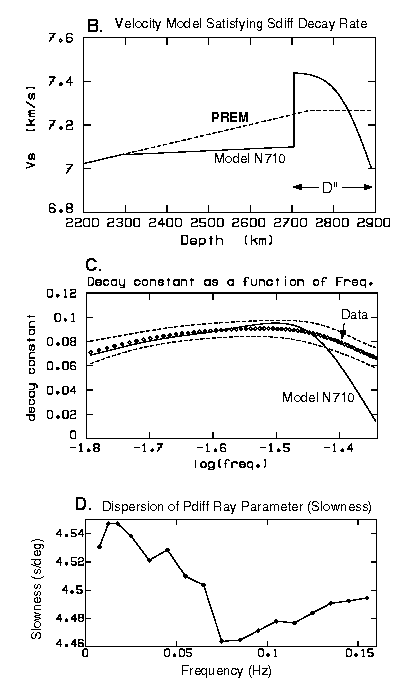

Figure 2: Observations and analyses of core-diffracted waves across the MOMA array. (a) A profile of Sdiff arrivals from an MW = 7.2 July 3, 1995, Kermadec earthquake, as seen on the transverse components. The waves arrive nearly along-strike, with a total range in azimuth of less then 1.5°. The slope of the arrivals on the distance-time plot is the ray parameter (or slowness), and indicates the average velocity structure of D″ at the core-mantle boundary (CMB) beneath the eastern Pacific Ocean. The rate at which the amplitudes of Sdiff decay with distance as a function of frequency is a strong indicator of the vertical velocity structure of D″. (b) The velocity model N710, that does a good job of representing the Sdiff amplitude decay rates for the Kermadec earthquake, shown in (c) [Valenzuela et al., 1996]. The model has a discontinuous increase in velocity about 180 km above the CMB, reminiscent of other models of vertical D″ structure in the mid-Pacific [Garnero et al., 1993]. Smooth D″ models like PREM [Dziewonski and Anderson, 1981], also shown, and models without a discontinuous increase do a very poor job of matching the data. (d) A plot of the Kermadec earthquake amplitude decay rates, expressed as exponential decay constants, for both the data and reflectivity synthetic seismograms computed using model N710.
