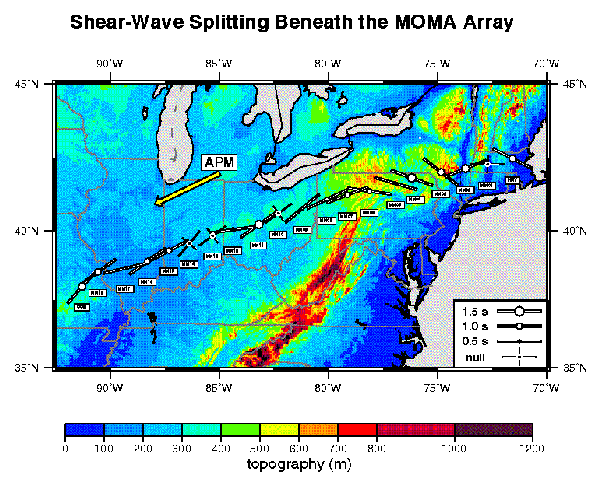
Figure 1: Shear-wave splitting parameters (fast direction ¢ and splitting time *t) determined from teleseismic SKS, SKKS, and PKS phases recorded at stations of the MOMA array and IRIS/GSN stations CCM and HRV [Fouch et al., 1996]. Station names are shown directly beneath each station. Values shown for ¢ and *t are computed by weighted averages of individual splitting measurements. ¢īs are shown by the azimuth of the bar plotted at the station; *t's are represented by circles scaled to the magnitude of the splitting time. Stations marked by crosses are those at which we have not yet documented anisotropy. Directions of these crosses represent the average back azimuth and its corresponding perpendicular direction for events that have yielded null measurements; the longer leg of the cross is aligned nearest the observed ¢īs at adjacent stations. Stations west from MM07 yield ¢īs that are roughly parallel to the direction of absolute plate motion (APM), while ¢īs from MM06 to MM03 show a smooth rotation to a more NW orientation. East of MM03, ¢īs vary by nearly 90° over length scales < 100 km. This figure is preliminary, because only about 25% of the data have yet been analyzed.
