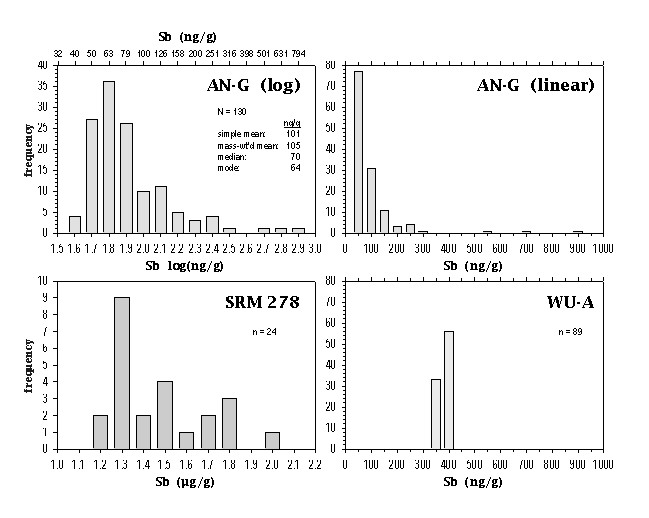
Fig. 2. Frequency histograms for the concentration of Sb in anorthosite AN-G (a,b) and obsidian SRM 278 (c). AN-G is shown both on a logarithmic (a) and linear (b) scale; the distribution clearly indicates that some Sb-rich phase is distributed nonuniformly among the subsamples. Sample masses for AN-G ranged from 30–300 mg, but averaged 140 mg. Data for other samples analyzed during the same time period, e.g., in-house standard WU-A (379 ± 3 ng/g Sb), do not show Sb anomalies (d), thus the anomalies showed by AN-G and SRM 278 are probably associated with the geostandard and are not an analytical artifact.